Unlock performance opportunities to capture energy savings, reduce energy consumption and improve your buildings sustainability
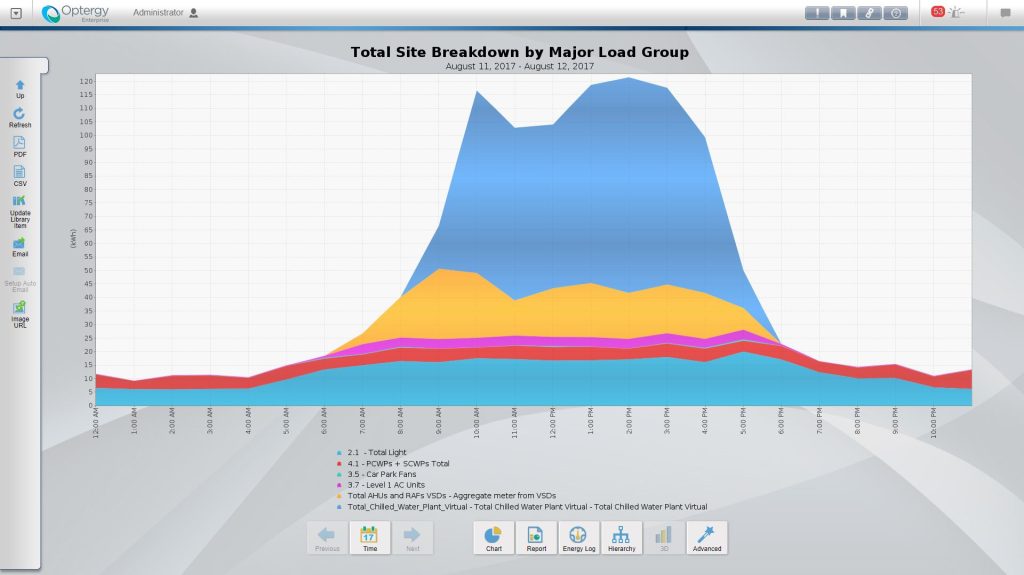
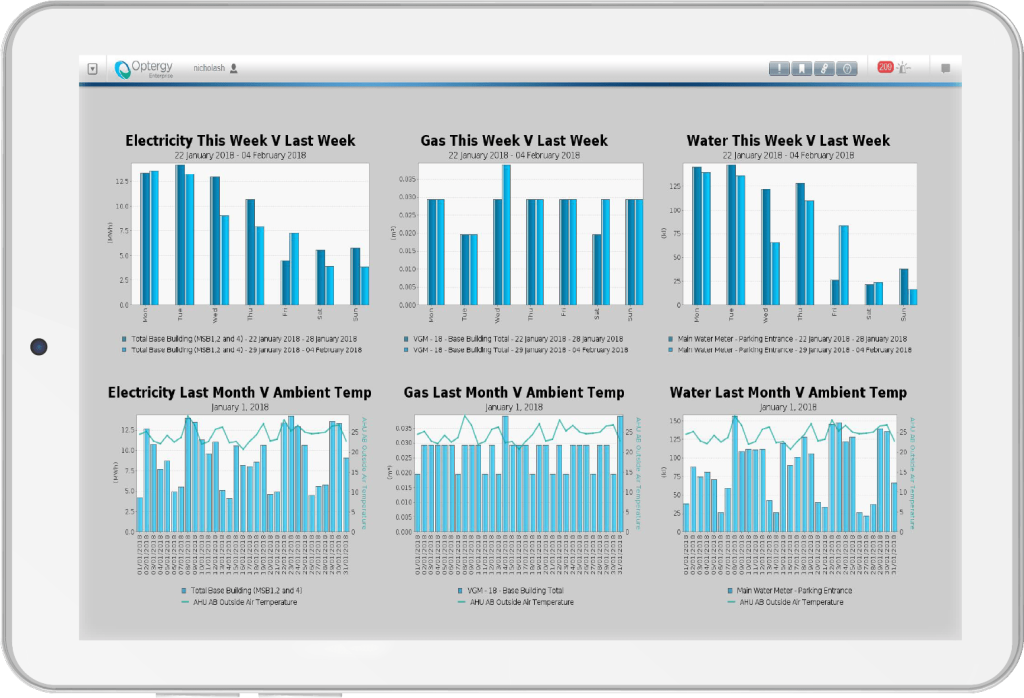
Visibility is the key to implementing sustainability initiatives in the built environment. What is not measured cannot be managed. Optergy provides the ability to visualize and report utility and meter data in real time. Displays can be created that provide an overview of utility performance with the ability to drill deeper for investigation purposes. This allows for fast fault diagnosis.
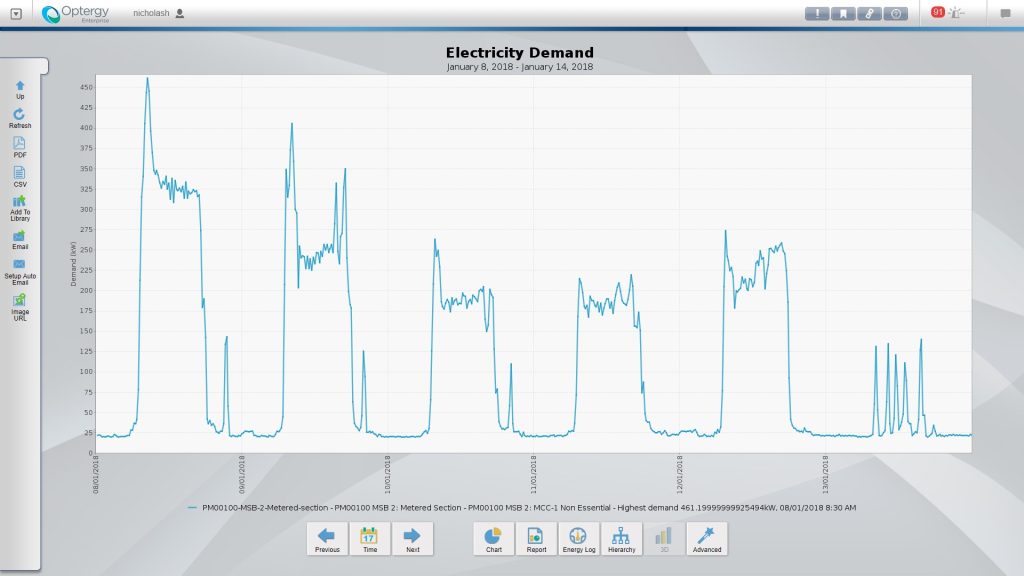
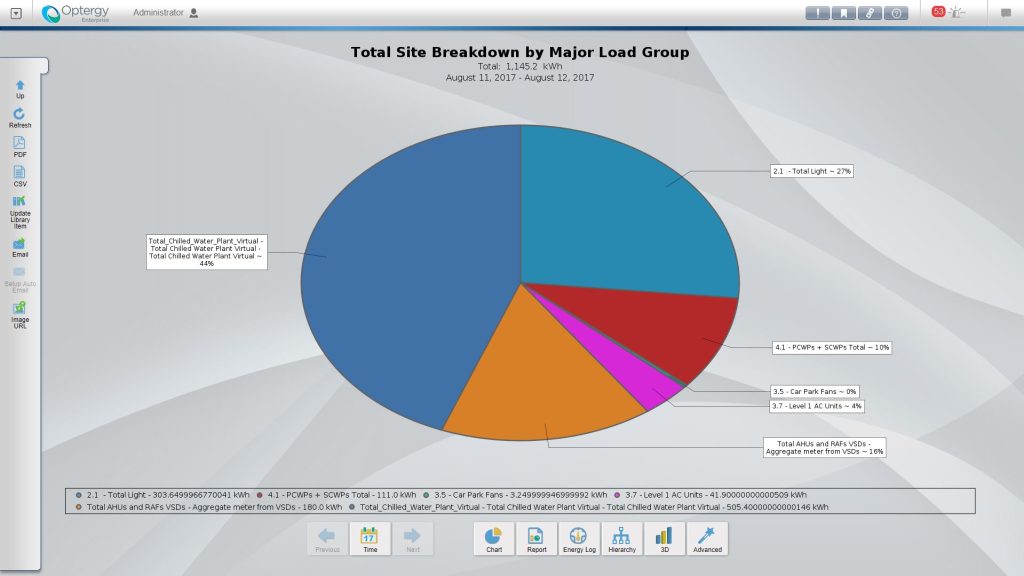
View reports, alarms and energy data from a single tenant, building or a portfolio of buildings in real time. User specific reports for major buildings or individual meters can be automatically generated and emailed via CSV or PDF. Out of normal condition alarming provides instant notification when problems arise.
End User Dashboard
Optergy has a built-in dashboard tool that users can create custom content for the purpose of viewing energy, operations, HTML content and weather data. Dashboards are created using widgets placed on to a display.
Dashboard page URL can be shared with other users of the system who have the appropriate privilege and are helpful for collaboration purposes.
Dashboard Supported Features
| Data progress bars | Digital gauges |
| Weather forecasts | Alarm list |
| HTML pages | Dial images |
| Chart images | Live boolean data point |
| Live range data point | Data comparisons |
Custom Report
Once a meter is set up in the Optergy software, a meter display page is automatically created based on the data available as defined by the meter type template. All data points on the meter display page are automatically logged so that engineering time is kept to a minimum during project delivery. Users can toggle the prebuilt report from day, week, month, year, consumption, demand or carbon emissions.